The Connundrum of European Tech and Artificial Intelligence
why Europe is lagging behind in ai investment and innovation
Thoughts
AI
Europe
Politics
Published
May 20, 2024
The European tech scene is a curious one. It is a region that is home to some of the oldest and most representative companies in the world, yet it is also a region that is often overlooked when it comes to tech investment. This is a paradox that has puzzled many observers, and one that has led to a number of questions about the future of European tech.
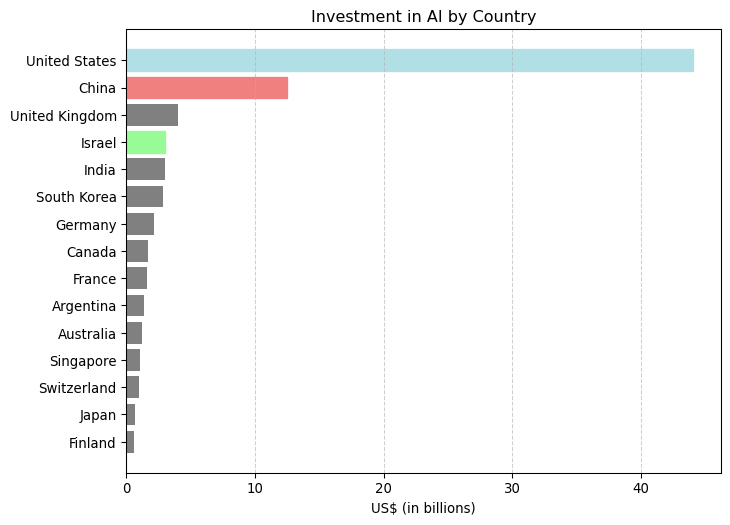
One can’t but notice the stark contrast between Europe and the US and China when it comes to areas such as Artificial Intelligence, and other cutting-edge technologies. Here’s investment data from the 2023 AI Index Report:
Show the code
import matplotlib.pyplot as pltcountries = ["United States","China","United Kingdom","Israel","India","South Korea","Germany","Canada","France","Argentina","Australia","Singapore","Switzerland","Japan","Finland",]values = [44.04,12.47,4.06,3.01,3.01,2.88,2.19,1.7,1.65,1.41,1.26,1.05,0.97,0.67,0.57,]# Creating a horizontal bar chartplt.figure(figsize=(8, 6))bars = plt.barh(countries[::-1], values[::-1], color="grey")bars[14].set_color("powderblue") # Highlight the United States with a different colorbars[13].set_color("lightcoral") # Highlight China with a different colorbars[11].set_color("palegreen") # Highlight Israel with a different color# Adding labels and titleplt.xlabel("US$ (in billions)")plt.title("Investment in AI by Country")plt.grid(axis="x", linestyle="--", alpha=0.6)# Show the plotplt.show()
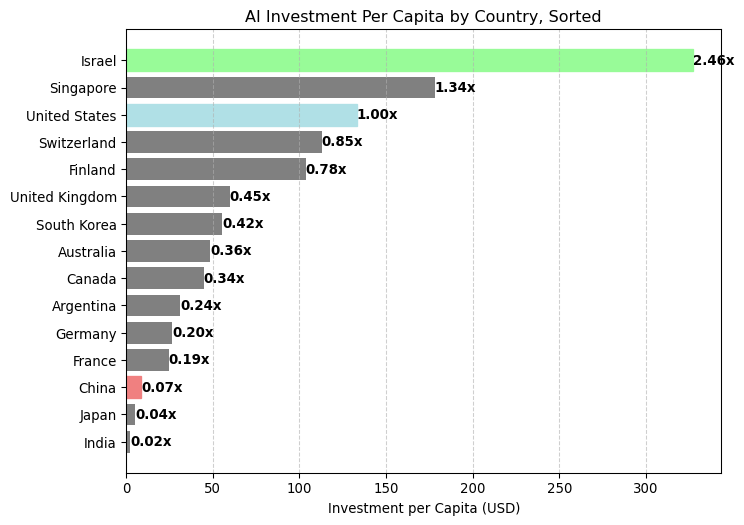
The US eclipses all other countries in AI investment, with China coming in second. The UK, Germany, and France are the only European countries in the top 15. Per capita, the figures also don’t look particularly great.
Show the code
import matplotlib.pyplot as plt# Given data for AI investments (in billion USD) and populations (in millions for simplification)countries = ["United States","China","United Kingdom","Israel","India","South Korea","Germany","Canada","France","Argentina","Australia","Singapore","Switzerland","Japan","Finland",]investments = [44.04,12.47,4.06,3.01,3.01,2.88,2.19,1.7,1.65,1.41,1.26,1.05,0.97,0.67,0.57,]# Approximate populations in millions (2022 data)populations = [331, 1441, 68, 9.2, 1380, 52, 83, 38, 67, 45, 26, 5.9, 8.6, 126, 5.5]# Calculate investment per capita (investment amount / population)investments_per_capita = [ (invest *1000000000) / (pop *1000000)for invest, pop inzip(investments, populations)]# Sort data by investment per capita in descending ordersorted_data =sorted(zip(countries, investments_per_capita), key=lambda x: x[1], reverse=False)sorted_countries, sorted_investments_per_capita =zip(*sorted_data)# Calculate ratios in comparison to the USus_investment_per_capita = sorted_investments_per_capita[12]ratios = [x / us_investment_per_capita for x in sorted_investments_per_capita]# Creating a horizontal bar chart with sorted dataplt.figure(figsize=(8, 6))bars = plt.barh(sorted_countries, sorted_investments_per_capita, color="grey")bars[12].set_color("powderblue") # Highlight the United States with a different colorbars[2].set_color("lightcoral") # Highlight China with a different colorbars[14].set_color("palegreen") # Highlight Israel with a different color# Adding labels and titleplt.xlabel("Investment per Capita (USD)")plt.title("AI Investment Per Capita by Country, Sorted")# Adding ratio labelsfor bar, ratio inzip(bars, ratios): plt.text( bar.get_width(), bar.get_y() + bar.get_height() /2,f"{ratio:.2f}x", va="center", ha="left", fontweight="bold", color="black", )plt.grid(axis="x", linestyle="--", alpha=0.6)# Show the plotplt.show()
France and Germany, the two largest economies in the EU, invest only 0.19 USD and 0.2 USD respectively for every 1 USD invested by the US. The UK does better, at 0.45 USD, but still only half of what the US invests per capita. Israel on the other hand, invests 2.4 times more per capita than the US, or 12 times more than Germany.
The Digital Europe Programme
The European Union has taken notice of this discrepancy and has launched the Digital Europe Programme to address it. The programme aims to invest 7.5 billion euros in digital technologies between 2021 and 2027, with a focus on areas such as high-performance computing, artificial intelligence, cybersecurity, and advanced digital skills. Considering how far behind Europe is in these areas, this investiment seems paltry, at best.
Of these 7.5 billion euros, 2.1 billion euros are earmarked for the development of AI technologies.
Venture capital
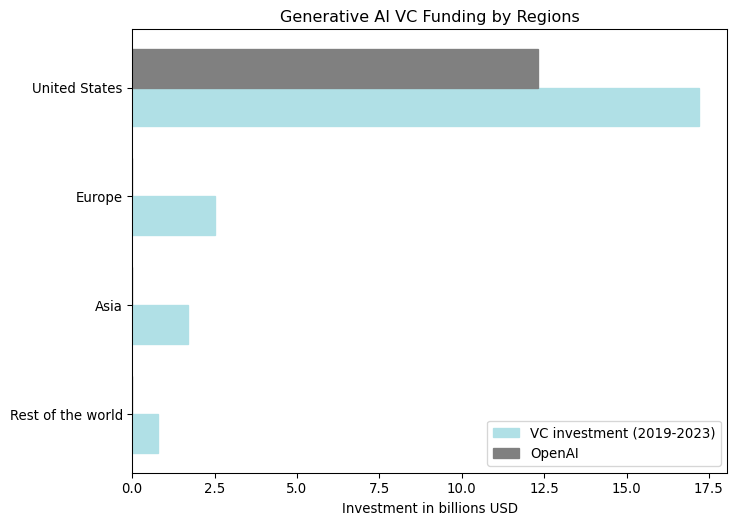
Another marked difference between Europe and the US is the availability of venture capital. Comparing VC investments related to AI in the US and Europe, the difference is staggering.
According to dealroom.co, the amount of VC investment in generative AI reached 29.5 billion US$ in the US between 2019 and 2023, while in Europe it was 2.5 billion US$. This is a remarkable difference, and one that is hard to ignore.
Show the code
import matplotlib.pyplot as plt# Data from the provided chartregions = ["United States", "Europe", "Asia", "Rest of the world"]vc_investment = [17.2, 2.5, 1.7, 0.773] # in billionsopenai_investment = [12.3, 0, 0, 0] # in billions# Reversing the order of the data to display the bars from top to bottomvc_investment_reversed = vc_investment[::-1]openai_investment_reversed = openai_investment[::-1]regions_reversed = regions[::-1]# Recreate the horizontal bar plot with reversed datafig, ax = plt.subplots(figsize=(8, 6))# Recalculate positions for reversed databar_width =0.35r1 =range(len(vc_investment_reversed))r2 = [x + bar_width for x in r1]# Make the plotax.barh( r1, vc_investment_reversed, color="powderblue", height=bar_width, edgecolor="powderblue", label="VC investment (2019-2023)",)ax.barh( r2, openai_investment_reversed, color="grey", height=bar_width, edgecolor="grey", label="OpenAI",)# Add yticks on the middle of the group barsax.set_xlabel("Investment in billions USD")ax.set_title("Generative AI VC Funding by Regions")ax.set_yticks([r + bar_width /2for r inrange(len(vc_investment_reversed))])ax.set_yticklabels(regions_reversed)# Create legend & Show graphicax.legend()plt.show()
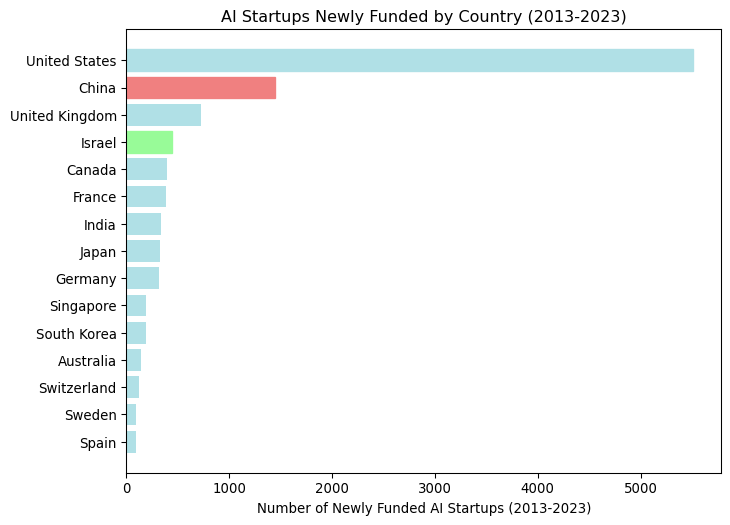
The number of newly funded startups in the AI space is also significantly higher in the US than in Europe.
Show the code
import matplotlib.pyplot as plt# Data from the provided tablecountries = ["United States","China","United Kingdom","Israel","Canada","France","India","Japan","Germany","Singapore","South Korea","Australia","Switzerland","Sweden","Spain",]startups_funded = [5509,1446,727,442,397,391,338,333,319,193,189,147,123,94,94,]# Sort data from largest to smallest number of startupssorted_indices =sorted(range(len(startups_funded)), key=lambda k: startups_funded[k], reverse=True)countries_sorted = [countries[i] for i in sorted_indices]startups_funded_sorted = [startups_funded[i] for i in sorted_indices]# Creating the horizontal bar plotfig, ax = plt.subplots(figsize=(8, 6))bars = ax.barh(countries_sorted, startups_funded_sorted, color="powderblue")bars[0].set_color("powderblue") # Highlight the United States with a different colorbars[1].set_color("lightcoral") # Highlight China with a different colorbars[3].set_color("palegreen") # Highlight Israel with a different colorax.set_xlabel("Number of Newly Funded AI Startups (2013-2023)")ax.set_title("AI Startups Newly Funded by Country (2013-2023)")plt.gca().invert_yaxis() # Invert axis to have the highest values on topplt.show()
This is reflective not only of the larger pools of capital available but also of a more aggressive investment culture in the US, where investors are quicker to back potentially disruptive technologies at an early stage.
Regulation, regulation, regulation
The regulatory environment in the US is often seen as more conducive to rapid innovation. American regulations can be more flexible, allowing new technologies and business models to be tested and scaled quickly. In contrast, European regulations tend to be stricter, focusing more on privacy and consumer protections, which can slow down the go-to-market time for new AI ventures. This includes not just the GDPR (which some say isn’t really working), but also the Digital Services Act and the Digital Markets Act.
In addition, the EU has now introduced the AI Act, which aims to regulate AI technologies, but which has been criticized for being too restrictive and potentially stifling innovation.
Talent
The talent pool also differs significantly between the two regions. The US benefits from a high concentration of top-tier AI research institutions and a robust hiring landscape that attracts talent globally. Europe, while also having strong universities and a well-educated workforce, often sees a brain drain where top talent moves to the US for better opportunities and higher salaries.
Moreover, the ecosystem for AI startups in the US is bolstered by a robust infrastructure of accelerators, incubators, and mentorship programs that are deeply integrated with the investment community. This ecosystem helps startups from concept to scale at an accelerated pace compared to Europe.
Can Europe catch up?
Given these challenges, can Europe catch up to the US and China? The answer is not straightforward. Europe has a number of advantages, such as a strong industrial base, a well-educated workforce, and a commitment to sustainability and ethical AI. However, it also faces significant hurdles, such as a fragmented market, a lack of venture capital, and a regulatory environment that can be seen as a double-edged sword.
From a more doubtful and cynical perspective, Europe’s chances of catching up may seem quite slim. The continent’s rigorous regulatory framework, while noble in its intentions to protect privacy and ethical standards, often acts as a bottleneck for rapid innovation and technological agility. This can be particularly stifling in a field like AI, where speed and flexibility are crucial for development and deployment.
Additionally, Europe’s fragmented market—characterized by varying languages, cultures, and legal frameworks—presents significant challenges for startups aiming to scale quickly across borders. This is a stark contrast to the more uniform markets of the US and China, where companies can scale more seamlessly.
While Europe undeniably has the potential to contribute significantly to the global AI landscape, its structural and systemic issues cast a long shadow over its ability to truly rival the dominance of the US and China. Unless there are substantial changes in how Europe fosters technological innovation and supports its tech industries, it may remain a step behind in the fast-moving world of artificial intelligence.