
flowchart LR
    A[Poor Software Engineering Team Performance]
    subgraph Tech[Technical Issues]
      B1[High Technical Debt]
      B2[Outdated Technologies]
    end
    subgraph Proc[Process Issues]
      C1[Inefficient Processes]
      C2[Unclear Requirements]
      C3[Poor Project Management]
    end
    subgraph People[People Issues]
      D1[Poor Communication]
      D2[Lack of Team Integration]
      D3[Inadequate Skills/Training]
      D4[Low Morale]
    end
    A --> Tech
    A --> Proc
    A --> People
    class Tech tech;
    class Proc process;
    class People people;
    classDef tech fill:#ffcccc,stroke:#cc0000,stroke-width:2px;
    classDef process fill:#ccffcc,stroke:#00cc00,stroke-width:2px;
    classDef people fill:#ccccff,stroke:#0000cc,stroke-width:2px;
I have spent a significant portion of my career trying to understand how engineering teams work together and scale, and working out ways to assist them in becoming more effective. If you have been in the same position, you probably know that it is a job which is never truly finished, and which often leads to no gratifying conclusion or a “thank you” at the end.
Working with people is hard, understanding personalities, how different people collaborate, and how to help them work better together is fiendishly difficult.
Despite all this, there is often a push to grow out of difficulties when something isn’t quite working or objectives are not met, by adding more people to the mix. The underlying assumption is that more bodies will get the job done faster, and as importantly, that people are fungible and can just be moved around and hit the ground running.
This couldn’t be further from the truth, and it often leads to disaster. Non-performing teams are so for a number of reasons, and it is uncommon for size to be the main one.
Why teams underperform
In the 2015-2016 Premier League season, Leicester City won the title with a team that cost less than a single player from Manchester City. It had been promoted to the Premier League just two years before, and was expected to be relegated. The team was made up of players who had been discarded by other clubs, and who had never played at the highest level. Yet, they won the title.
It was a shock to everyone, and probably the greatest underdog story in the history of football. It was also a testament to the fact that teams are not just about the sum of their parts, but about how those parts work together. In software engineering, the same is true. Often underperformance arises because of ways of working rather than individuals, and often, not because a team is short on staff.
There are many factors that can lead to poor performance - experience, motivation, communication, technical debt, technical or organisational complexity, and many others. An experienced team lead or engineering manager will be able to identify these factors and work to improve them, but only if they are given the time and resources to do so as part of their role. Trying to fix a team in motion during a tight deadline or complex project is like trying to fix a car while it is running.
In modern engineering practices, and especially in software architectures with lots of moving parts and dependencies, it is very easy to introduce friction between project members, or between teams. For example, if one team adopts modern CI/CD, but another is still using traditional testing, friction between the two will increase and it will be hard to get effective cooperation. Equally, if a team decides to adopt an approach (say, an :link event driven architecture), but very few members have the necessary skills or experience, friction will happen between more and less skilled or experienced individuals, leading to inefficiencies and possibly burnout.
Friction leads to the need of more communication, which in turn leads to more potential misunderstandings, and more time spent on clarifications. This is a vicious cycle that can only be broken by reducing points of contact and conflict, not by adding more people to the mix. This is where good team leads and engineering managers come in - they need to identify these sources of difficulty and misalignment, and work to reduce them or minimise their impact.
Meetings
A sure fire way to identify a team that is not working well is to look at the number of meetings they have. Lots of scheduled, regular meetings with little or no agreed agenda or with no clear outcome, are a sign that the team is not managing to communicate effectively, and there is some form of compensation happening. Equally, if a team is getting together regularly, but the same small group of people are doing all the talking, is probably a good indicator that something isn’t working quite well or there is a problem with lack of experience.
Software engineering requires deep thought, concentration, and a lot of time ideating and trying different things out. This can be done effectively with one to one’s or in very small, cohesive groups, but hardly by more than two or three people at a time. The more a meeting’s attendance grows, the less effective it will be, and the potential for wasted time.
Ideally, a meeting should last an amount of time that is inversely proportional to the number of attendees and frequency. The more people will attend, the less time it should last, and the less frequent it should occur. If a regular meeting is held every day for an hour, one should probably question why it is needed, and what the desired outcome is.
A good rule of thumb is that a meeting should have a duration of \(4/n\), where \(n\) is the number of participants. Anything beyond that is probably a waste of time.
Show the code
import numpy as np
from bokeh.plotting import figure, output_file, save, show, output_notebook
from bokeh.models import ColumnDataSource

output_notebook(hide_banner=True)

# Define the range of participants (n)
n_values = np.linspace(2, 10, 10)
d_values = 4 / n_values

# Set up the Bokeh data source
source = ColumnDataSource(data=dict(n=n_values, d=d_values))

# Create the Bokeh figure
p = figure(
    title="Meeting Duration vs. Number of Participants",
    x_axis_label="Number of Participants (n)",
    y_axis_label="Duration (hours)",
    width=600,
    height=400,
)
p.line("n", "d", source=source, line_width=2, color="green")

show(p)
Heroics
In the software industry, there is a tendency to reward heroics and to find a 10x engineer” to solve all the problems and bring the team to the next level. Taking the previous football parallel, Leicester City did not have a single superstar player, but instead a cohesive group of players who worked together and who were motivated to win. Adding a very senior, highly productive engineer to a group which is not working well will most likely not solve the problem, it will just decrease the productivity of the new member.
A chain is only as strong as its weakest link, and a team is only as strong as its weakest member. The goal should be to make the team work better together as a group, not to find a hero to save the day.
There is an exception to this, as bringing in a highly skilled engineer to mentor and coach the team can be very beneficial. This is not to solve the team’s problems, but to help the team address them themselves. The mentor should be there to guide, not to do the gritty work entirely. However, this strategy can quickly backfire if the team does not accept a mentor to be brought in. Choosing and supporting the right person is key to success in this case, and it is crucial that people are willing to accept the help.
The right technology isn’t necessarily the best technology
It is very easy, especially when the wrong incentives are in place, to pick a technology which is not right for the circumstances at hand. People want to work with the latest and greatest, and often the choice of technology is driven by what is desirable rather than what is right. It can lead to long learning curves, and the need for significant investment in time and resources to get everyone up to speed.
Even when the willingness to invest is there, some teams will just not have the appetite to learn or follow new things - this happens way more often than one would assume. Especially when a given technical choice was not a voluntarily one. On the other hand, an eager team without accompanying experience can make choices that it can’t deliver on. It is important to have a balance between what is desirable and what is achievable; helping people with due diligence is vital in high-risk/high-reward projects.
Technical debt and legacy
Technical debt is a concept that is often misunderstood, and which can lead to significant problems if not managed properly. It is not just about code, but about the processes, the tools, the documentation, and the people. It is about decisions that were made in the past, and the consequences of those decisions. Teams that have been fighting technical debt for a long time will ultimately become very adept at fighting fires, but will find it very hard to innovate and move forward. This leads to an environment where the team is constantly playing catch-up, and where the focus is on fixing problems rather than on delivering value.
In the past I have worked with teams who were absolutely convinced that they were highly effective - indeed the team was delivering “things” and meeting deadlines. However they were doing little else but fix bugs, delivering incremental features that were not needed and which were not used, building only what was possible rather than what was needed. The footprint of the product wasn’t evolving, and staleness had crept in a long time ago. Legacy can and will kill a product in many ways, not necessarily by the code itself, but by the lack of innovation and the lack of willingness to change.
Scaling laws
There are a few scaling principles that anyone working in technology should be able to grasp. The first is :link Conway’s law, which states that “organizations which design systems (…) are constrained to produce designs which are copies of the communication structures of these organizations.” In practice, a system’s architecture tends to mirror the org chart and communication paths of its creators. A misaligned software architecture and team structure can lead to inefficiencies or unintended design complexity.
You have probably seen this in practice, where a monolithic codebase becomes unwieldy as the team grows, or distributed teams struggle with tightly coupled microservices. For instance, a startup’s early system, built by a single cohesive team, often evolves into a tangled mess of dependencies once the company scales into departmental silos (engineering, product, DevOps). Suddenly, the software reflects fragmented priorities and communication gaps, with teams duplicating efforts or bypassing critical integrations. Many businesses now even use the inverse Conway maneuver - reorganizing teams to achieve a desired software architecture.
Another important principle is Brooks’ Law - “Adding manpower to a late software project makes it later.” Fred Brooks’ classic lesson warns that simply throwing more developers at a slipping project often backfires. New team members take time to ramp up and increase communication overhead, which can further slow progress. This law has been validated “project after project across engineering teams of all sizes”, reminding us to be cautious about scaling headcount as a solution, as it leads to diminishing returns due to increased coordination costs.
Show the code
import math
import matplotlib.pyplot as plt

# Define range for n values
n_values = list(range(3, 12))
num_plots = len(n_values)
cols = 3
rows = (num_plots + cols - 1) // cols  # Ceiling division for rows

# Create subplots
fig, axes = plt.subplots(rows, cols, figsize=(cols * 2, rows * 3))
axes = axes.flatten()  # Make it easier to iterate

for ax, n in zip(axes, n_values):
    ax.set_title(f"{n} people, {n*(n-1)//2} lines")

    # Set equal aspect and limits
    ax.set_aspect("equal")
    ax.set_xlim(-1.2, 1.2)
    ax.set_ylim(-1.2, 1.2)

    # Hide axes
    ax.axis("off")

    # Compute circular coordinates
    coords = [
        (math.cos(2 * math.pi * i / n), math.sin(2 * math.pi * i / n)) for i in range(n)
    ]

    # Draw all connecting lines
    for i in range(n):
        for j in range(i + 1, n):
            x_coords = [coords[i][0], coords[j][0]]
            y_coords = [coords[i][1], coords[j][1]]
            ax.plot(x_coords, y_coords, linewidth=1, color="green")

    # Draw vertices
    xs, ys = zip(*coords)
    ax.scatter(xs, ys, s=20, color="darkgreen")

# Hide any unused subplots
for ax in axes[num_plots:]:
    ax.axis("off")

plt.tight_layout()
plt.show()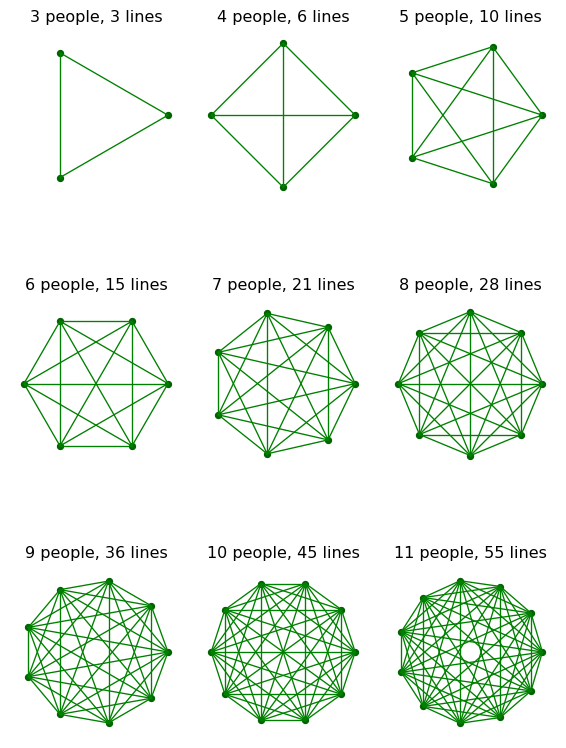
Finally, Dunbar’s number, where anthropologist Robin Dunbar found that humans maintain stable social relationships in groups up to about 150. In small teams (under approximately 10 people), everyone communicates frequently and informally, but beyond certain sizes, additional structure and process are needed. Teams exceeding roughly 100–150 people often lose cohesion, requiring formal interfaces and roadmaps to coordinate. Effective scaling often involves breaking organizations into smaller units to stay within these cognitive limits. Dunbar’s number is probably much smaller in complex environments. I am sure many of us have found that teams of five or seven people can easily become unmanageable without the right conditions in place.
Pizza teams
A common way to think about team size is the “two pizza rule” - if it can’t be fed with two pizzas, it is too large. The pizza rule emerged in Amazon, Jeff Bezzos famously said that he wanted to keep teams small enough that they could be fed with two pizzas. The idea is that smaller teams are more efficient, more agile, and more effective. They can communicate more easily, make decisions more quickly, and are more likely to be cohesive.
This isn’t always true, but there is wisdom in the rule. Smaller groups in a sense force communication, as there are fewer people to talk to, fewer people to make decisions, and lead to easier consensus. Smaller teams can also lead to a more resilient, distributed architecture, as they are less likely to build monolithic systems that are hard to change.
Small and incremental, but keep an eye on the target picture
Whenever a team, or a group of teams is working on an innovation initiative, there is a tendency to want to start fresh and build something completely new. More often than not this leads to failure, as the team is not able to deliver on the promise, resulting in the project being cancelled or the team disbanded. It is vital to start small, build incrementally on what is there already, but to keep an eye on the target picture and to make steady, continuous progress towards it. This is where good product management comes in, as they are able to keep the team focused on the goal, and to help them make the right decisions along the way. As any initiative moves forward, product management becomes the linchpin that transforms early, incremental successes into a coherent long-term vision. They serve as the bridge between engineering, design and the market, ensuring that incremental progress aligns broadly.
For this approach to work, it is imperative that engineering teams and product managers have aligned incentives and goals, and that they are working towards the same outcomes. Engineering typically think of the product as a set of features, while product think in terms of delivered value. The two are not the same, and teams often need help working towards the same goals.
They also need support to test out ideas, to :link fail fast, and to learn from their mistakes. It is hard to determine what is valuable and what is not, and it is important to have a process in place which supports rapid discovery, experimentation, prototyping and validation of new ideas. This is where the concept of :lean startup comes in, and where the team needs to be able to pivot quickly, to change direction, and to adapt to new information. It is also important that product managers buy into this approach, and that they are able to support the team in their efforts.
A model for team productivity
It is always useful to visually intuit how some of the factors we discussed interact with each other and impact the ability of an engineering team to deliver. Let us quickly model how team integration, communication, and technical debt can affect team productivity as project size increases. The following widget allows you to adjust the sliders for team integration, communication, and technical debt, and see how the productivity curve changes. Each slider represents the amount of friction introduced by the corresponding factor, i.e., as you move the sliders to the right you are saying that the team has more friction due to that factor. The productivity curve is based on a simple model that combines these factors to estimate the team’s mid productivity level, as well as the uncertainty range around it.
You can estimate where the team is in regards to these factors, and put each slide at the right level to estimate where they are in the productivity curve. “Productivity” in this case means the amount of time the team spends delivering value, rather than spending time just fixing things, trying to understand what is needed, just talking to each other, or attempting to integrate various aspects of what they developed (a productivity of zero means the team is basically not delivering anything, while a value of one means they are delivering at full capacity).
The model is very simplified, but should give you a good intuition on how these factors interact.
Show the code
import numpy as np
from bokeh.plotting import figure, output_file, save
from bokeh.models import ColumnDataSource, Slider, CustomJS, Band
from bokeh.layouts import column

# Decay factor for technical debt
k = 1.0


# Function to compute mid productivity based on project size and factors.
def compute_mid_productivity(sizes, team_integration, communication, technical_debt):
    # Base factor: higher integration & communication reduce friction.
    # Technical debt now decays productivity exponentially.
    base = (1 - 0.5 * (team_integration + communication)) * np.exp(-k * technical_debt)
    # Exponential decay with increasing project size.
    return base * np.exp(-0.03 * (sizes - 1))


# Baseline uncertainty fraction at maximum project size
baseline_uncertainty = 1.0

# Initial parameter values
initial_team_integration = 0.2
initial_communication = 0.2
initial_technical_debt = 0.2

# Create an array for project sizes
sizes = np.linspace(1, 100, 100)
max_size = sizes[-1]

# Calculate the mid productivity curve.
mid_productivity = compute_mid_productivity(
    sizes, initial_team_integration, initial_communication, initial_technical_debt
)
# Compute effective uncertainty: baseline uncertainty scaled by the average friction factor.
effective_uncertainty = baseline_uncertainty * (
    (initial_team_integration + initial_communication + initial_technical_debt) / 3
)
# Scale uncertainty: linear from 0 at size=1 to effective_uncertainty at max_size.
scale = (sizes - 1) / (max_size - 1)
lower_productivity = mid_productivity * (1 - effective_uncertainty * scale)
upper_productivity = mid_productivity * (1 + effective_uncertainty * scale)

# Set up the Bokeh data source.
source = ColumnDataSource(
    data=dict(
        x=sizes,
        y_mid=mid_productivity,
        y_lower=lower_productivity,
        y_upper=upper_productivity,
    )
)

# Create the Bokeh figure.
p = figure(
    title="Team Productivity vs. Project Size",
    x_axis_label="Project Size",
    y_axis_label="Productivity",
    width=600,
    height=400,
)
p.line(
    "x",
    "y_mid",
    source=source,
    line_width=2,
    color="green",
    legend_label="Mid Productivity",
)

# Add a band between lower and upper curves.
band = Band(
    base="x",
    lower="y_lower",
    upper="y_upper",
    source=source,
    level="underlay",
    fill_alpha=0.2,
    line_width=1,
    line_color="gray",
    fill_color="green",
)
p.add_layout(band)
p.legend.location = "top_right"

# Create sliders for team integration, communication, and technical debt.
slider_team = Slider(
    start=0,
    end=1,
    value=initial_team_integration,
    step=0.01,
    title="Team Integration",
    show_value=False,
    tooltips=False,
)
slider_comm = Slider(
    start=0,
    end=1,
    value=initial_communication,
    step=0.01,
    title="Communication",
    show_value=False,
    tooltips=False,
)
slider_td = Slider(
    start=0,
    end=1,
    value=initial_technical_debt,
    step=0.01,
    title="Technical Debt",
    show_value=False,
    tooltips=False,
)

# Define a JavaScript callback to update the productivity curves when slider values change.
callback = CustomJS(
    args=dict(
        source=source,
        slider_team=slider_team,
        slider_comm=slider_comm,
        slider_td=slider_td,
        baseline_uncertainty=baseline_uncertainty,
        max_size=max_size,
        k=k,
    ),
    code="""
    const data = source.data;
    const x = data['x'];
    const y_mid = data['y_mid'];
    const y_lower = data['y_lower'];
    const y_upper = data['y_upper'];

    const team = slider_team.value;
    const comm = slider_comm.value;
    const td = slider_td.value;

    // Compute the base factor with exponential decay for technical debt.
    const baseFactor = (1 - 0.5 * (team + comm)) * Math.exp(-k * td);

    // Effective uncertainty scales with the average of the friction factors.
    const effective_uncertainty = baseline_uncertainty * ((team + comm + td) / 3);

    // Update productivity curves.
    for (let i = 0; i < x.length; i++) {
        y_mid[i] = baseFactor * Math.exp(-0.03 * (x[i] - 1));
        let scale = (x[i] - 1) / (max_size - 1);
        y_lower[i] = y_mid[i] * (1 - effective_uncertainty * scale);
        y_upper[i] = y_mid[i] * (1 + effective_uncertainty * scale);
    }
    source.change.emit();
""",
)

# Attach the callback to slider value changes.
slider_team.js_on_change("value", callback)
slider_comm.js_on_change("value", callback)
slider_td.js_on_change("value", callback)

# Arrange the plot and sliders in a layout.
layout = column(p, slider_team, slider_comm, slider_td)

# Save the interactive plot as an HTML file.
output_file("team_productivity.html")
_ = save(layout)
Moving forward
To conclude what is now a long list of ideas and learnings, what absolutely matters is that teams are supported in moving forward and in delivering value. This is not about adding more people, or about finding a hero to save the day, but about helping the team work better together, making the right decisions along the way. It is about reducing friction, and helping everyone to communicate more effectively, to integrate better, and work towards a common goal.
It is also about :link decentralising decision making rather than making it entirely top-down, and empowering the team to make the right decisions themselves. Ultimately consensus should be an emergent property, arising from giving the team the right information, the right tools, and the right incentives to make their way forward while fostering autonomy and accountability. It is about helping everyone to learn from their mistakes, to pivot quickly, and to adapt to new information. It is about helping the team to experiment, to prototype, and to validate new ideas. Helping them to fail fast, and to learn from their failures as well as their successes. All this I believe is essential for fostering a culture of innovation and continuous improvement.
Reuse
This work is licensed under CC BY (View License)